

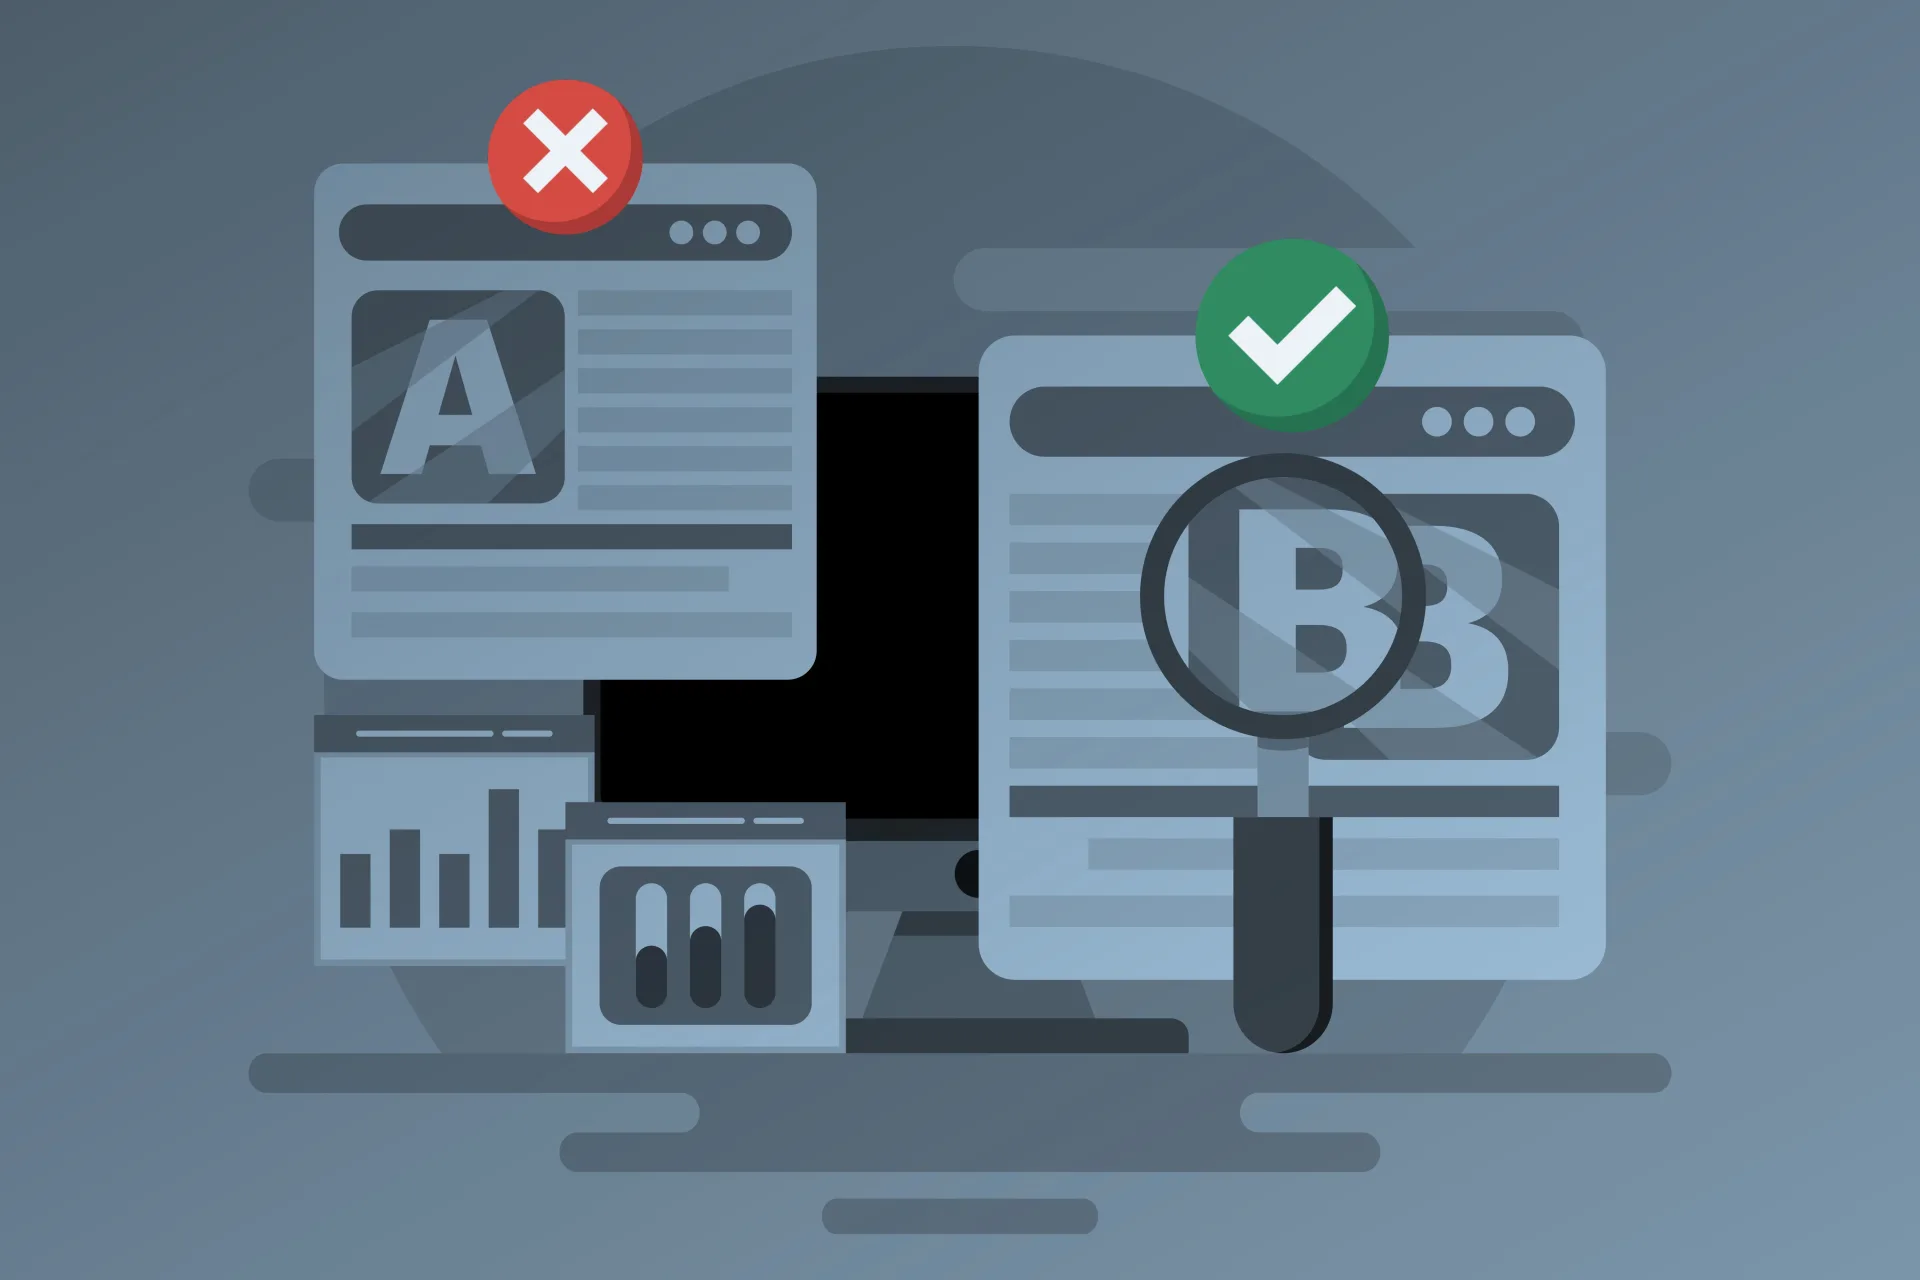
Here’s a story the internet loves. You change the button from green to orange, run a test for a week, and enquiries jump 18%. Version B wins. Roll it out, high-five the designer, move on to the next test.
On a site with half a million visitors a month, that story can be true. On a typical Nigerian business website, it’s usually a coincidence wearing a lab coat. The damage starts when you roll out the coincidence as if it were proven, then build your next three decisions on top of it.
So let’s talk about what testing looks like at your size. You’ll see why small sites can’t test small changes, you’ll get a calculator that tells you whether your test is even possible, and you’ll get five ways to improve a page with confidence when your traffic is too low to test anything.
Why Your Week-Long Test Proved Nothing
An A/B test shows two versions of a page to similar visitors and counts how many from each group convert. Simple enough.
In 2010, Paul the Octopus correctly picked the winner of eight straight World Cup matches. Nobody concluded that octopuses understand football. A week-long test on a small site is Paul with a dashboard.
The trouble is that conversions are rare and random. Put two identical pages against each other and one will almost always be “ahead” after a week, by pure chance. To separate a real improvement from a lucky week, you need enough conversions that luck stops being a believable explanation.
How many is enough depends on your current conversion rate and on how small an improvement you’re trying to spot. The table uses a standard approximation for a test at 80% power and 5% significance, the settings statisticians use by default, and shows the visitors each version needs.
| Current conversion rate | To detect +10% | +25% | +50% | +100% (double) |
|---|---|---|---|---|
| 1% | 158,401 | 25,344 | 6,336 | 1,584 |
| 2% | 78,400 | 12,544 | 3,136 | 784 |
| 5% | 30,400 | 4,864 | 1,216 | 304 |
| 10% | 14,400 | 2,304 | 576 | 144 |
Take the 2% row. Say 2% of your visitors enquire today, and you want to know whether a new headline lifts that by a quarter, to 2.5%. You need about 12,544 visitors on each version, around 25,088 in total. A page with 1,500 visitors a week would need about four months to answer one question. And a 25% lift is a big result. Most tweaks don’t come close.
That’s why “we tested it and B won” is so often wrong on small sites. The test stopped long before it could tell a real effect from a good Thursday.
Run Your Own Numbers
Put in your page’s current conversion rate, the smallest improvement worth acting on, and how many visitors the page gets each week.
Test duration calculator
It uses the same approximation as the table, so treat it as a planning tool. If your test comes out borderline, take that as a hint to test something bolder.
Six Rules If the Calculator Says Yes
- Write the hypothesis first. “Changing the headline to name the customer’s problem will increase enquiries, because interviews showed people search for the problem rather than our service.” A good hypothesis teaches you something even when the test loses.
- Fix the sample size in advance, and don’t peek your way out. Checking daily and stopping the moment one version leads is the most common testing mistake there is. Early leads are unreliable, and stopping on one sharply raises your chance of crowning a false winner.
- Run whole weeks. People behave differently on weekdays and weekends, and again at month-end when salaries land. Run at least two full weeks, even if you hit your sample size sooner.
- Test one idea at a time. A test can change several elements, as long as they express one idea. Change the headline, the price and the photos together, and if B wins you won’t know which one did it.
- Count the action that matters. Measure enquiries or purchases. A version that gets more clicks and fewer enquiries has lost, however good the click numbers look.
- Write down what happened outside. A viral post, a public holiday or a competitor’s promo during the test can drown out whatever you were measuring. Note them, and be suspicious of results from strange weeks.
Five Ways Forward When the Calculator Says No
For most small business pages, it will say no. That’s fine. You can still improve the page and know it worked, using methods built for your scale.
Make the change big enough to see
Look back at the table. Detecting a doubling takes a sliver of the traffic that detecting a 10% lift does. Big changes are testable on small traffic, and tweaks aren’t. So forget button colours. Test a page built around the customer’s problem against one built around your features. Test published prices against “contact us for pricing”. Test a short page against a long one. If an idea is too small to make a large difference, it’s too small to test at your traffic, and you should decide it on judgement.
Test where the crowd already is
Your ads may get more impressions in a week than your site gets visits in a month. Ad platforms will happily run two messages against each other and tell you which earns more clicks and conversions. Use that to learn which problem statement, offer or proof point lands, then carry the winner onto your pages. For a small business, it’s often the quickest way to find the words that work.
Watch people use the page
Session recording tools like Microsoft Clarity (free) show anonymised recordings of real visits, plus heatmaps of where people click and scroll. You don’t need statistical significance to notice that most visitors never get past the first screen, that people keep tapping a photo that isn’t a link, or that everyone gives up at the third form field. Five hours of watching will usually show you your biggest problems. Make sure your privacy notice covers whatever tool you use.
Ask
Some problems never show up in traffic data, however much of it you have. Two quick ways to find them.
- The five-second test. Show your page for five seconds to someone who doesn’t know your business. Then ask what you do and what they’d do next. If they can’t say, the page isn’t clear.
- Customer interviews. Ask recent customers, and people who didn’t buy, what nearly stopped them. The interview script has the questions.
Compare before and after, carefully
If you can’t split traffic, compare a period before a change with a period after it. It’s much weaker evidence, because everything else that changed in between, from seasonality to ad spend to the news, gets mixed into the result. Make it fairer by comparing periods of equal length, skipping holidays and odd weeks, holding the rest of your marketing steady, and checking the same period last year. Treat what you find as a signal, and stop short of calling it proof.
Spend Your Weeks on These
When every test costs you weeks, pick the ideas with the biggest possible effect. For most service businesses, roughly in order of impact:
| Area | Examples of bold tests |
|---|---|
| The offer | Free consultation versus free audit; a starter package versus a single full package |
| Price visibility | Published prices versus “contact us”; a starting price versus a full price list |
| The headline angle | The customer’s problem versus your service name; a specific outcome versus a general promise |
| Proof | Case studies with real numbers near the top versus at the bottom; named reviews versus anonymous ones |
| The next step | WhatsApp first versus a form first; booking a call versus requesting a quote |
| Friction | A three-field form versus an eight-field form; guest checkout versus required accounts |
Notice what’s missing. Button colours, font sizes and small wording changes can matter on very large sites. On yours, their effect is almost certainly too small to detect, and the weeks spent testing them belong to any row above.
A Testing Habit You Can Actually Keep
- Measure first. You can’t test what you can’t track. Make sure your key actions are recorded properly, which the GA4 setup guide walks through.
- Find the problems by watching and asking. Recordings, five-second tests and interviews show you where the page fails.
- Fix the obvious ones without testing. A wrong phone number or a form that breaks on mobile needs fixing today. Save testing for genuine uncertainty.
- Test the big, uncertain ideas. Check feasibility with the calculator. If it’s feasible, run a proper test. If it isn’t, test the message in your ads first.
- Log every result, failures included. A record of what you tried, what happened and what you learned beats any single test.
Before You Start Another Test
Run the sample-size numbers. If your traffic can’t reach an answer in reasonable time, test a bolder change, move the question into your ads, or watch ten recordings and call three recent enquirers. For the wider picture, read the conversion rate optimisation guide and the landing page guide.
Green or Orange?
Pick whichever you like. Then go and find out why people who reach your page leave without enquiring, because that’s where the money is.
The free 2-minute diagnostic is a quick place to start. It shows which of your four walls is weakest, and pages that don’t turn visitors into enquiries usually show up under Convert.
P.S. If you spend ₦1M or more a month on marketing, you also qualify for a free Leak Check, a 30-minute call on three places your money is leaking. We won’t spend a minute of it on button colours.
Sample sizes use a standard approximation (80% power, 5% two-sided significance) meant for planning. They don’t replace a full statistical analysis. Tools and features change. Session recording tools collect visitor data, so cover them in your privacy notice and take qualified advice on your NDPA obligations.
This article covers one part of a bigger system. Our guide to digital marketing in Nigeria shows how the four walls fit together, and the order to build them in.